
Product documentation
Work with charts and generated files
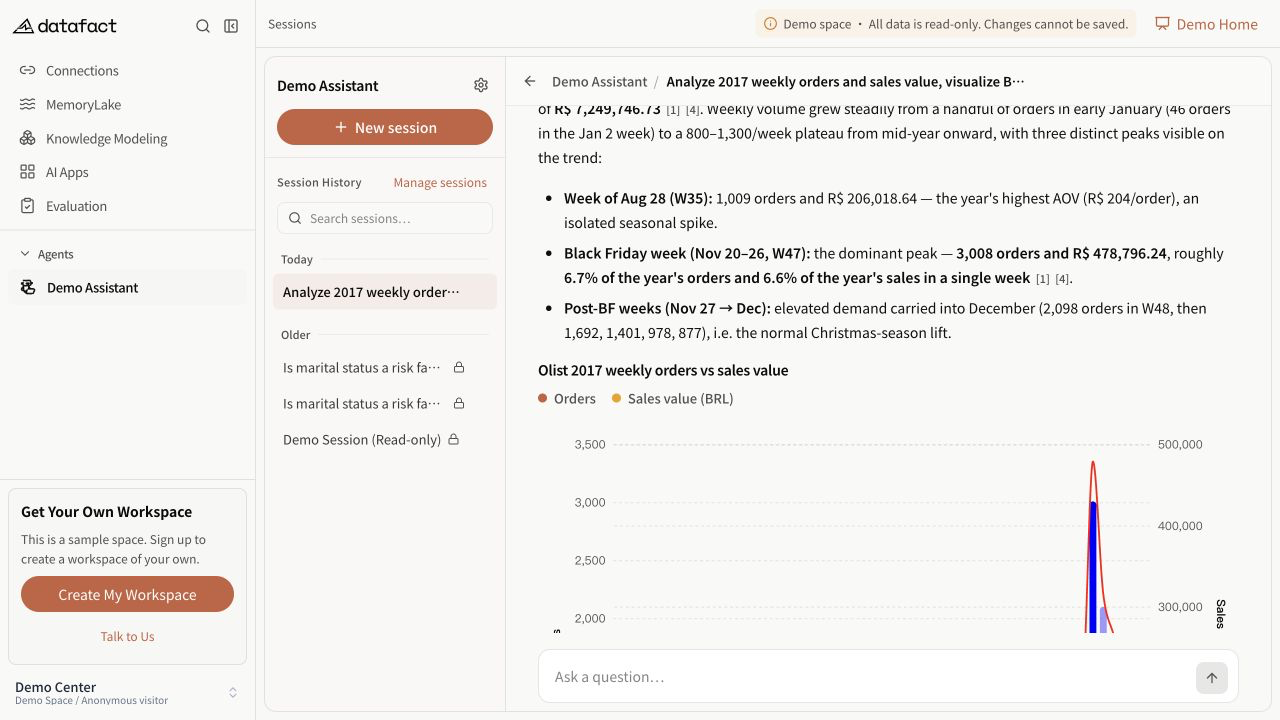
An answer can include charts, data tables, or generated files. These outputs appear only when the Agent produces them.
Review a chart
- Read the chart title and surrounding final answer.
- Check each axis, unit, legend, category, filter, and time range.
- Compare visible totals or trends with any accompanying table.
- If a label or unit is missing, ask a follow-up question instead of guessing.
Charts visualize returned data; they do not replace source verification.
Use a generated diagram
When an answer contains a supported Mermaid diagram, DataFact renders the diagram instead of showing the source block.
- Use the zoom control to zoom out, reset to the original size, or zoom in.
- Scroll the diagram area horizontally when the rendered content is wider than its container.
- Open Export and choose PNG for a raster image or SVG for a scalable vector file.
If the diagram syntax cannot be rendered, DataFact keeps the source code visible with an error message. Do not interpret the failed source block as a completed diagram.
Open a generated file
- Find the file in the answer or result-files area.
- Review the file name and type.
- Use the available preview or download action.
- Open the downloaded file with an application appropriate for its type.
PDF, supported Office files, and CSV files can provide an in-product preview in supported answer contexts. Images and some text-based formats can also be previewed. Other files may be download-only. Available actions can vary by file and viewing context.
Safety and validation
- Treat generated files as answer output, not as an authoritative source by default.
- Verify formulas, units, row counts, filters, and date ranges before sharing the result.
- Do not enable macros or run executable content from a generated file unless your organization's security policy permits it.
- If the file cannot be opened, keep the visible file name and error for support.